

Midyear Reflections of the Markets and Economy
We Are in a Bear Market, Now What?
After much speculation, its confirmed, we officially entered a bear market closing below 20% from the January 3rd top earlier this year.
As I am penning this article on the last day of June, the S&P 500 Index (SPX) has rallied a little under 3% from its recent June 17th low, but the question remains…was that the bottom? My answer typically is I’ll let you know in a year as we don’t know yet if it truly was or not. We do have some historical data that may help to inform us on the path forward.
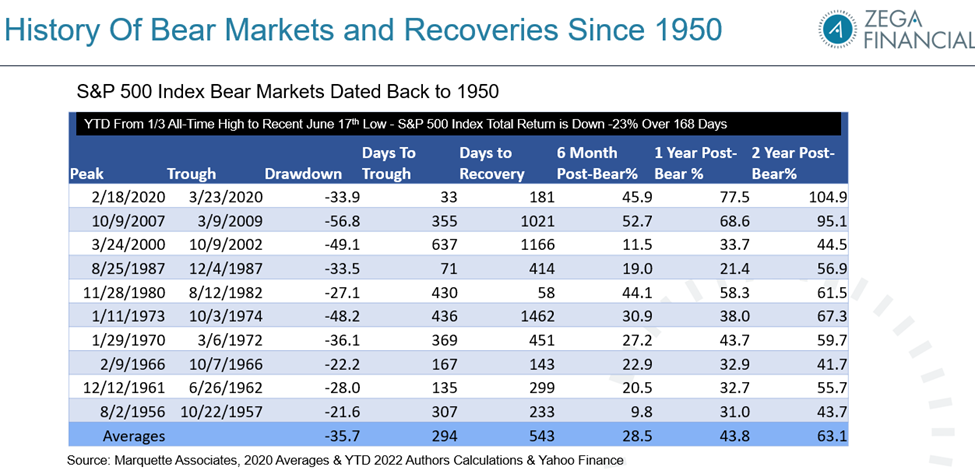
Above you can see the table illustrating SPX bear markets dated back to 1950.
Included are the dates (peak to trough), days it took to get to the trough, and days to recovery back to the previous high. The trough is a fancy way of saying the bottom. We also can see the returns forward once a bottom is in 6 months after, 1 year after, and 2 years post bear.
Finally, the average lengths of the intra-cycles of bear markets and the average returns from a bottom.
What we see is that in all of these, once the bottom is determined, markets tend to be higher. You may also notice that several times a large chunk of the move post bear is gained in that first 6 months to a year period.
Its tough to time markets. Since we do not know when the bottom is truly in, and we don’t know when the recovery starts, we think its best to stay invested but be hedged.
The 4th Worst First 6 Months of the Year Start for the S&P 500 Index

Source: Yahoo Finance
Here we can see yes, 2022 has come in among the worst starts to the year.
We can see in the other cases the next 6 months tended to have fairly good returns. Other times markets continued lower in the second half of the year. This is another we will see what happens instances. Interest rates and inflation certainly dominate the headlines, but thus far corporate earnings estimates have held up and net profit margin expectations remain robust at decades highs.
Forward PE estimates are now lower than the 25-year average.
So far, this selloff has been a re-rating of stocks as earnings continue to be up year over year, but what investors are willing to pay for stocks has come down.
The second quarter earnings releases will start to ramp up in a few weeks which will provide more clarity about the path forward.

Some people have been asking if this is a repeat of the 2000 Dotcom crash.
I would say no primarily just looking above at the companies that made up the biggest weighting of the Nasdaq 100 Index in March of 2000 vs the end of June. Yes, Sirius Satellite Radio was the number 1 company. In the year 2000 they lost -$137 million dollars. In the trailing 12 months today, Apple has net income over $100 billion; a very different story.
In March of 2000, the index was trading around 100 times future earnings as compared to around 18-19 times today.
What About Short Duration High Yield and Senior Loans?

If we look at some of the year-to-date total returns near the recent lows, short duration high yield (SJNK) and senior loans (SRLN), both in orange, have been down less than most of the fixed income complex.
What might surprise many is the second from the left is TIP, and ETF that holds Tips or Treasury Inflation Protected Securities. It was down close to -9%, even though we have the highest inflation since the late seventies and early eighties. They do have interest rate risk, and many were trading at a negative yield to maturity in the early part of the year.
For our hedged equity portfolios utilizing short duration high yield to help pay for our long market exposure, we have been in some of the better performing fixed income sectors.
What Happens Historically to High Yield After a Downturn?

I have highlighted the boxes with high yield in yellow above on the periodic table of fixed income asset classes.
What you should notice is that often when high yield is among the worst performing fixed income assets, it tends to move to the top of the chart in subsequent years. This represents high yield in general not just short duration high yield.
Short duration fixed income has less interest rate risk and high yield has higher coupon payments in general than investment grade bonds or US treasuries.
One of the risks, among others with fixed income and high yield in general, is a higher level of defaults or bankruptcies.
You can see below that default rates remain lower while recovery rates, what percentage of par value investors recover in bankruptcies, are above average.

Won’t High Yield Companies Have to Refinance at These Higher Rates?

It appears that many companies have locked in lower interest rates already.
Above we see the amount of US Junk (High Yield) debt that matures each year. Notice not as much comes due where companies would have to pay down the debt or refinance by issuing new bonds to roll the debt in the next few years.
We will continue to watch the underlying aspects of the fixed income markets.
Tying it Together with Our Core Strategies
For many investors, a longer drawn-out downturn is something they may not have experienced before.
December 2018 and March of 2020 were quick declines and recoveries. We cannot control or predict markets, but we know that controlling your risk and setting buffers or floors on equity losses can help investors stay in the markets.
As we said we will let you know when the official market bottom is in, but since we can’t time the start of recoveries, we believe it’s best to stay invested but be hedged.