

US Treasuries Third Worst Start to Year Since 1830 – Market Reaches New Highs While Many Big Names In Correction Territory?
By Derek Moore
Trouble with Treasuries
It probably is not a surprise that treasuries have had negative returns year to date given the rise in interest rates. Bonds have an inverse response to rates going higher. But how bad? According to a piece in Barrons, its the 3rd worst start to a year since 1830. Bloomberg TV today mentioned this was the worst quarter to date return on bonds since 1980.
Since 1830 there have only been two years when it has gotten off to a worse start: 1980, and 2009
- Jim Reid, Deutsche Bank via Barrons
So how bad has the quarter been? If we look at three symbols IEF, TLT, and ZROZ we get a sense for how the rise in rates has negatively impacted bonds across the duration landscape. These three represent 7-10 years, 20+, and 25+ Zero Coupon. The longer the duration and the lower the starting interest rate prior to the rise, the more of a change you will see. We’ve been talking about this type of risk for a while in presentations, podcasts, and the blog itself.

Source: Schwab ETF Comparison Tool YTD Performance
For those of you thinking, did we really have US Treasuries in 1830? It’s a long story but for the historians out there, the first form of a US Treasury was issued in 1812 as part of the funding effort for the War of 1812, see here.
If anyone was interested, according to the source I linked to, the rate on that 1-year bill was 5.4%.
New Market Highs Yet Big Names Still in Correction Territory? Be Indexed but Hedged!
This week the market is once again at or near all time highs. Yet what is odd compared to the last decade is that the names propelling the rise are not momentum tech. Instead, it is coming from more of the value factor. Consider just a few names below that are off from their most recent highs:
Percent Down from Most Recent All-Time High
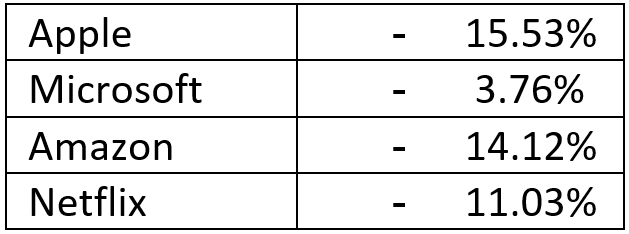
Data Source: TD Ameritrade with authors calculations
If I told you Apple would be over 15% off its most recent high and still in correction territory, yet the market is making new highs you probably wouldn’t believe me. Yet this is another good reason to use broad indexes and have a hedged equity strategy. Kind of like Buy and Hedge, right?
This also speaks to the difficulty in picking which individual stocks will perform best relative to the market. Now not all the tech names are faltering. Facebook and Google have had a good run of late. But the leadership has shifted.
Putting in Context of Goldman Sachs 8% GDP Growth Forecast

Data Source: Federal Reserve Bank of St. Louis with authors calculations
Recently Goldman Sachs updated their GDP growth estimates to 8% in 2021, 3.5% in 2022, and 3.2% in 2023. That seemed to get the talking heads on CNBC chatting about growth we’ve not seen for years and what that will mean for inflation. Some context is needed given that we had no growth in 2020 despite coming roaring back from the Q2 astonishing pullback in GDP.
From the above chart, if we take the final 2020 Real GDP figure and project out with the Goldman numbers and compare it to the final 2019 figure but use a 2.5% annual growth rate, we can see that their forward-looking end point would only be slightly higher than a hypothetical no pandemic scenario with average growth.
Real GDP Hypothetical Goldman Sachs Estimates vs No Pandemic 2.5% Annual Growth

Data Source: Goldman Sachs, Federal Reserve Bank of St. Louis ,with authors calculations
So, as we say goodbye to the first quarter of 2021, we will be watching these and other themes as the year progresses. Until next time, Be Hedged!