

How Do Markets Do During Midterm Elections and Presidential Cycles?

Source: Schwab Center for Financial Research
Presidential Cycles and Market Returns
With the midterm elections coming up Tuesday November 8th, we wanted to lend some historical perspective on how markets do post-midterms.
We also thought it interesting to view the markets through the lens of the presidential cycle (shown above in the graph). Simply, a President serves four years per term so year 1 is the post-election year, year 2 mid-term, year 3 pre-election, and year 4 election year. Currently, 2022 is year 2 of President Biden’s cycle.
The data point that jumps out is year 3. From 1933-2015 during year 3, markets saw higher up 90.5% of the time with the highest average annual return. While we never know for certain what markets will do, that seems promising for 2023.
The data above only went to 2015, so I calculated the years since including Biden’s years through end of July. Here are the returns by presidential year.
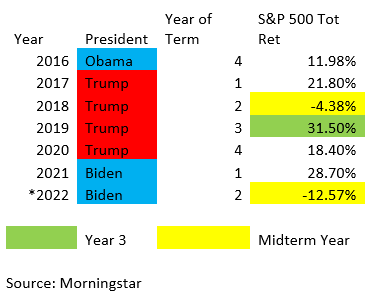
Year 3 for Trump, 2019, was the highest return during his term, staying consistent with the trend.
Markets During Midterm Years and Beyond
The midterm years for both Trump and Biden (2018 and 2022 YTD) have been down. This brings us to the second theme which is historically mid-term years see markets flat to down before moving higher post-election day. Capital Group a few years ago posted a comparison of markets in mid-term years vs. all others.
You can see below historically, at least from 1931-2018, it seems midterm years have been a bit more challenging leading up to the election. However, there is a pattern of upward trend post-election during the midterm years.

Source: Capital Group
Since 1962 Markets Historically Always Higher After Midterm Elections?
 US Bank put out a piece with midterm elections back to 1962 which showed historically, markets never were lower 6-12 months after the midterm election.
This period also coincides with year 3 of Presidential cycles we referenced earlier. Three months post-election there were instances of small declines, but on average you can see the S&P 500 Index historically outperforms at all three intervals (3 months post, 6 months, 12 months). You also can see in the year prior to midterm elections, markets had some material declines that wound up reversing higher afterwards. While we never know what markets will do going forward, this type of data supports staying invested but being hedged in case markets don’t follow history.
This post-midterm period and 2023 will be interesting to follow to see if it holds true. Currently there is a lot of fear listening to financial news media but taking a step back and having some historical prospective shows us that midterm years have seen declines in the past leading into the election.
In the meantime, reach out to a ZEGA team member for more information on how you can stay invested in markets, but hedge downside moves.