
Buy & Hedge Retirement Strategy Peer Comparison Update
By Derek Moore
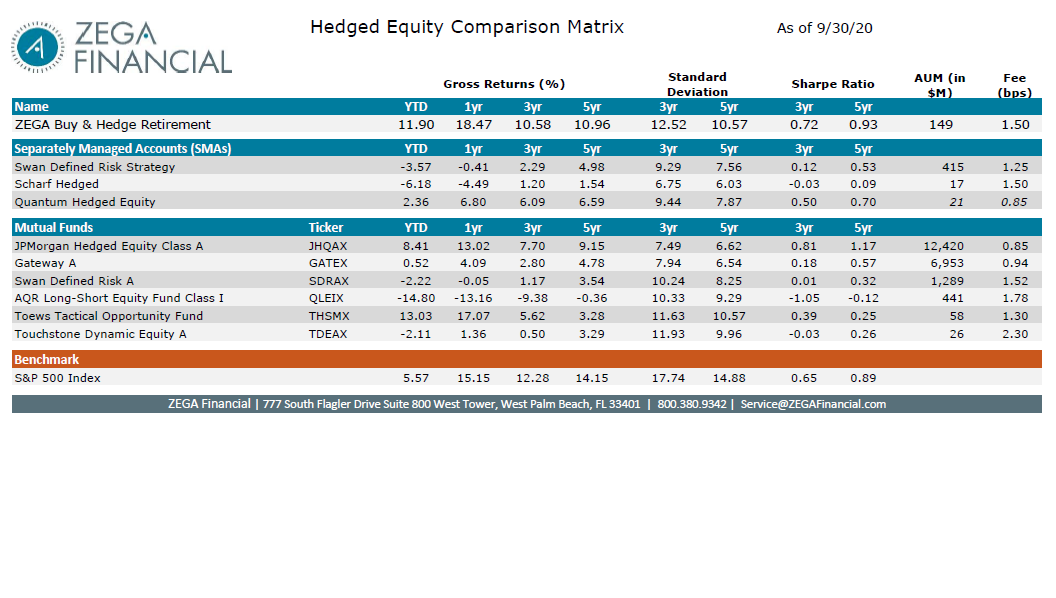
With the 3rd quarter coming to an end once again its time for a Buy & Hedge Retirement Strategy update focused on our peer comparison review. This is an opportunity to see how the strategy stacks up with a collection of others in the space. While these all do not exactly replicate our strategy, if provides a good anchor for the conditions over the past 1, 3, and 5 years.
2020 has been quite an interesting year. Its hard to believe that Halloween is less than 2 weeks away. Before you know it, Christmas shopping will be in full swing. The February and March stress in the markets seems long ago for many. But those months were a great reminder of why we hedge and why advisors find value in our hedged equity strategies.
If you have been following our updates, the ZEGA trading team institutes tactics designed to help clients capture more of market rebounds after selloffs. Given 2020’s action, this helped the strategy outperform for a hedged equity strategy as markets recovered. An important aspect of this was doing so without adding additional material risk.
So where does ZEGA’s version of a hedged equity strategy rank compare to some other managers in the space? Over a 1-year, 3-year, and 5-year lookback period it attained the top return spot as you can see by the graph above. Only the YTD (year to date) trailing period has us out of the top spot while still sitting in second. From a risk standpoint, our Sharpe Ratio only trailed one other manager on both the 3-year and 5-year.
While we many of you know the Sharpe Ratio calculation by heart; just as a refresher below is how to arrive at those numbers.
Sharpe Ratio Formula

Rp = Return of the Portfolio
Rf = Risk Free Rate
STDp = Standard Deviation of Portfolio
I point this out as first, it is a standard measure of risk adjusted returns, but also a barometer of how much volatility clients experience to produce a given return. The higher the better for this measure.
We think the other aspect of the peer comparison worth mentioning is the consistency of the returns where we did not experience larger drawdowns coupled with outsized gains. We have been fairly level across various time periods compared to some in the peer group. This is highlighted by something like the Sharpe Ratio on the comparison.
This speaks to the use case for the strategy which can include pre-retirees (or post retirees) looking to add growth without adding substantial market risk to their assets. By the way, right before retirement and right when a retiree starts drawing from assets can be two of the most critical times for this group. We know that the order of returns does not really matter unless someone is taking money out or moving money into a strategy. Yet, once those withdrawals start to augment retirement income, the first years in retirement need protection as significant drawdowns can impair one’s ability to have their assets last with them.
Right before retirement, a significant market drawdown is tough to recover from since they will not have material prime working and saving years to make up this shortfall. For these and other reasons we like the idea of protected growth to try and build the right base for clients.
So, with that, this concludes another peer comparison review. Click below for a PDF version. As always feel free to contact ZEGA with questions on the strategy.
